
ChatPlot vs Microsoft Visio: shape libraries vs a described diagram
Visio is a Microsoft 365 drawing tool with shape libraries, file formats and per-user plans. ChatPlot draws a diagram from a description and edits it when you ask.
Microsoft Visio is a drawing tool sold with Microsoft 365: shape libraries, a web app, a desktop app on the higher plan, and its own file formats.
ChatPlot is a diagram tool with a chat next to it. You describe what the diagram should show, it draws one, and each change after that is another sentence.
At a glance
The ChatPlot column comes from ChatPlot's own plan rules. The Visio column comes from Microsoft's Visio product page and plans and pricing page as read on September 11, 2026; where those pages did not state something, the table says so.
| ChatPlot | Microsoft Visio | |
|---|---|---|
| How you make a diagram | Describe it in plain language. Layout is automatic; you pick the direction and theme and ask for changes in words. No manual drag-and-drop positioning. | By drawing with shapes. Plan 1 lists "Thousands of shapes and Microsoft product icons"; Plan 2 lists "250,000+ shapes and custom shapes with programmability" and a desktop app with offline and local file support. |
| Real-time collaboration | Not available: no co-editing, no shared workspaces. A share link carries the diagram inside the link and opens without an account. | Yes: "Real-time collaboration, commenting, and sharing with the Visio web app or the Visio app in Microsoft Teams". |
| AI generation | The main way to create and change diagrams (templates and the advanced code editor are the alternatives). 5 actions per guest session, 10 per calendar month on a free account, 500 per month on Pro. | Not shown on either official page: Copilot appears only in the site navigation and footer. |
| Export formats | PNG and SVG. Diagram code is an advanced opt-in. No PDF. | "Save diagrams in PNG or JPEG format, or as a PDF", plus SVG export and DWG import, which the page places in Plan 2. Files are saved as .vsdx. |
| Free tier | Guest: 5 AI actions per session, up to 3 diagrams kept in the browser. Free account: 10 per calendar month, unlimited diagrams synced. Both export PNG and SVG with a small chatplot.io mark. | No free plan shown. The web app is "Included in Microsoft 365 commercial plans", which are themselves paid. |
| Paid plans | Pro, $15 per month or $144 per year: 500 AI actions per month, no mark, PNG up to 3x resolution. No Team or Enterprise plan. | Plan 1 at "$5.00 user/month, paid yearly" and Plan 2 at "$15.00 user/month, paid yearly". Visio Standard 2024 and Professional 2024 are linked as one-time purchases, with no price shown. |
What the ChatPlot side looks like
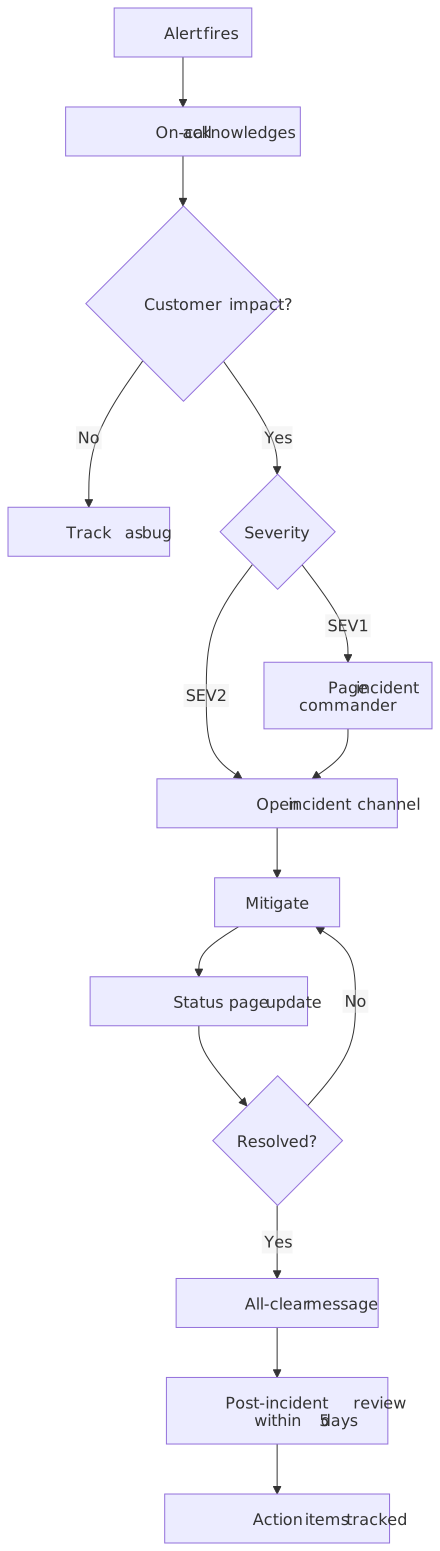
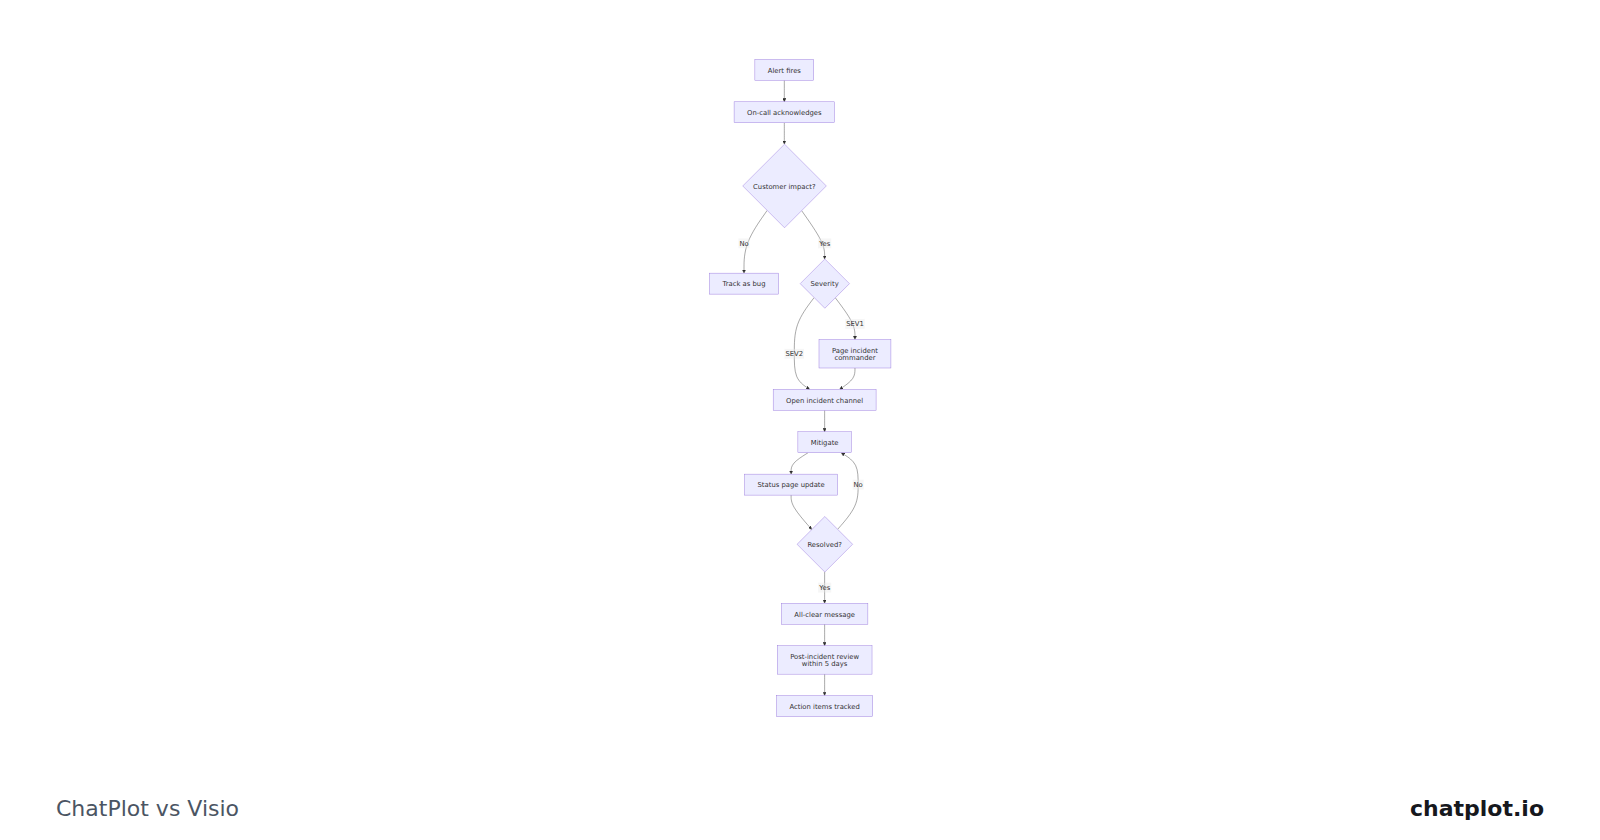
The triage branch and the loop back to mitigation were written as sentences, not drawn. An edit such as "add a customer communications step for SEV1 only" redraws the chart around it: you cannot nudge a box a few pixels, and you never have to.
Where Visio is the better fit
- You need the file, not just the picture. Visio saves .vsdx and imports DWG; ChatPlot handles neither.
- You need shape fidelity: Plan 2 lists 250,000-plus shapes and custom shapes with programmability.
- Several people need to edit one diagram at once, with comments, in the web app or in Teams.
- You already pay for Microsoft 365, which includes the web app; Plan 1 is $5.00 per user per month paid yearly.
Where ChatPlot is the better fit
- Nobody on the team wants to draw, and describing the process is the whole job.
- You want an AI first draft. Microsoft's Visio pages do not show AI diagram generation; in ChatPlot it is how every diagram is made.
- You want to revise by asking, with version history keeping what came before.
- You want to send it outside the company, through a link that needs no account or license.
Try the same task in both
Task: the on-call incident response flow above. In ChatPlot, type this:
Draw an incident response flowchart. An alert fires and the on-call engineer acknowledges it. If there is no customer impact, track it as a bug and stop. Otherwise set the severity: SEV1 pages the incident commander, SEV2 opens a channel. Then mitigate, post a status page update, and check whether it is resolved; if not, go back to mitigation. When it is, send an all-clear, hold a post-incident review within 5 days and track the action items.Then make one edit by asking:
Add a customer communications step after the status page update for SEV1 only, and change the review deadline to 3 business days.That is two AI actions. Failed requests are not charged, and templates, undo, version history, direction and theme changes, exports and share links never use one. The incident response template is the same diagram, if you would rather start there.
Bottom line
Visio suits a diagram that is a company artifact: a .vsdx file, a standardized shape set, a license that already exists inside Microsoft 365, and several people editing at once. ChatPlot suits a diagram that is a way of thinking out loud, where the most accurate version is a paragraph you already know how to write. One plain difference: Microsoft's Visio pages do not advertise AI diagram generation, while in ChatPlot it is how almost every diagram starts.
Sources
Competitor details were read from these pages on September 11, 2026 and may have changed since.